
Dashboard
Overview is the first page you see after signing in, with a snapshot of sales, money owed and stock.
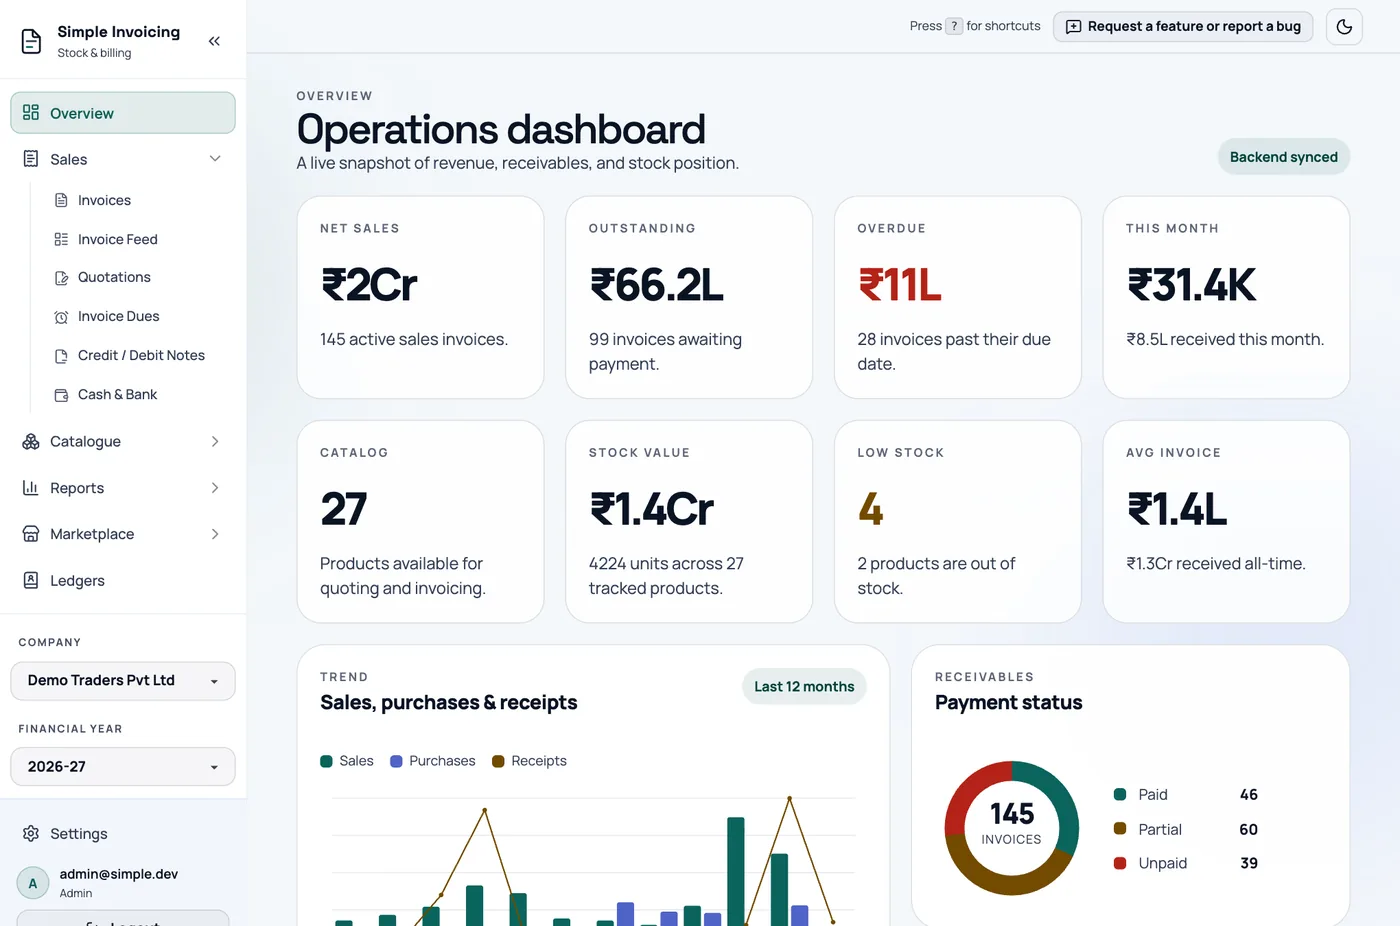
The dashboard has no date or financial-year filter. Figures cover all dates for the active company, except where the card says this month or last 12 months. Cancelled invoices are not counted.
Get started
A new company sees a Get started checklist here: add a customer, add a product with opening stock, create your first invoice and, optionally, add your bank details. Steps tick off as you finish them. It goes away once you have created an invoice, or click its close button to hide it.
The cards
| Card | What it shows | Click to open |
|---|---|---|
| Net sales | Total of all active sales invoices, including GST. Credit notes are not subtracted. | |
| Outstanding | What customers still owe on sales invoices. | Invoice Dues |
| Overdue | The part of that past its due date. Turns red when above zero. | Invoice Dues |
| This month | Sales invoiced since the 1st, and receipts this month. | |
| Catalog | How many products you have. | Products & Stock |
| Stock value | Quantity × purchase price, across stock-tracked products. | Products & Stock |
| Low stock | Products at or below their reorder level, and how many are out of stock. | Low stock list |
| Avg invoice | Total sales ÷ number of sales invoices. |
Large amounts are shortened, such as ₹66.2L. Hover over a figure for the full amount.
The panels
- Sales, purchases & receipts: a monthly chart for the last 12 months.
- Payment status: how many sales invoices are paid, part paid and unpaid.
- Inventory pressure points: up to five stock-tracked products. Products that are out of stock or at or below their reorder level come first, with the lowest quantities first within each group.
- Top products by revenue: your five best sellers.
- Latest activity: the six newest invoices. Click one to preview it.
For figures over a chosen period, use Analytics.